
Defining market size
The article draws on forecasts for market growth during 2025–2029. One report may measure annual transactions while another measures development revenues, asset values or a subsector; these numbers are not directly comparable. Establish publisher, date, currency, coverage, method and base year before use, distinguishing nominal values from real growth.
Growth drivers by segment
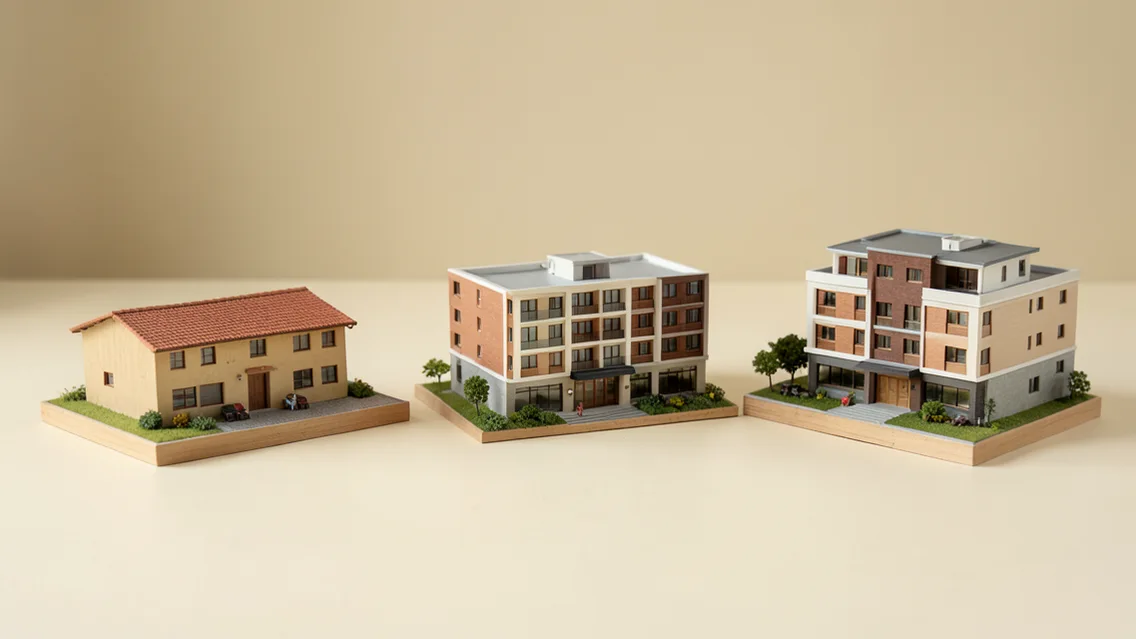
The article discusses housing, hospitality, offices and PropTech in the national transformation context. Examine each segment independently: household formation and affordability for housing, visits and occupancy for hospitality, and jobs and occupied floor area for offices. Growth in one segment does not establish growth elsewhere, and announcements do not establish delivered supply.
Testing the 2029 forecast
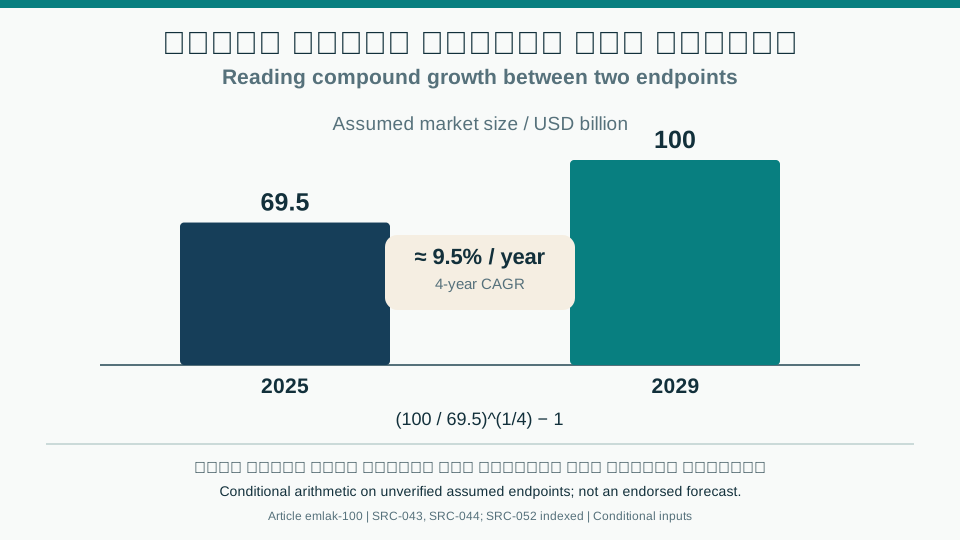
If an analyst assumes USD 69.5 billion in 2025 and USD 100 billion in 2029 with a consistent definition, the implied compound growth is about 9.5% annually over four years. This is conditional arithmetic, not verification of either estimate. Test construction, land, financing, delivery and absorption scenarios, updating forecasts as actual data emerge.
Decision review table
| Factor | Evidence or action |
|---|---|
| Market definition | Coverage, methodology and unit |
| Housing | Households, affordability and stock |
| Other segments | Occupancy, visits and jobs |
| Forecast | Assumptions, period and scenarios |
A visual reading of the article topic
- 01Defining market size
- 02Growth drivers by segment
- 03Testing the 2029 forecast
- 04Decision review table
Practical workflow
- 01 Define market
- 02 Verify base year
- 03 Test assumptions
- 04 Update forecast with evidence
Conceptual editorial diagram; not measured data.
Topics and source excerpts
| Topic | Excerpt from article |
|---|---|
| Defining market size | The article draws on forecasts for market growth during 2025–2029. |
| Growth drivers by segment | The article discusses housing, hospitality, offices and PropTech in the national transformation context. |
| Testing the 2029 forecast | If an analyst assumes USD 69.5 billion in 2025 and USD 100 billion in 2029 with a consistent definition, the implied compound growth is about 9.5% annually… |
| Practical workflow | 01 Define market |
| Sources and limitations | Editorial development based on the author’s original Emlak article; previous text retained. |
Source excerpts organized for comparison, not newly researched findings.
Sources and limitations
Editorial development based on the author’s original Emlak article; previous text retained. Original USD 69.5 and 100 billion estimates, ownership targets, projects and policies require dated sources and clear definitions. The calculation assumes 2025 and 2029 endpoints and is not an endorsed forecast.
- REGA: Real Estate Indicators FAQ — Location, type and time filters and coverage limits; averages do not value a specific property.
- GASTAT: Real Estate Price Index methodology, April 2025 — Indexed methodology on changes by category, region, period and registered transactions, 2023 base; not a 2026 results release or growth forecast.
- REGA: Real Estate Indicators Platform — Distinguishes transaction count, value, area, mean transaction value, outstanding loan balances and new individual residential finance; no numerical series or forecast adopted.