Separate price from activity
Transaction volume counts deals during a period, while a price index measures changes in asset prices using a defined methodology. Financing constraints may reduce buyers and owners may delay selling, weakening liquidity without an equivalent price decline. Residential, commercial and agricultural assets and different locations can respond differently.
Transaction mix effect
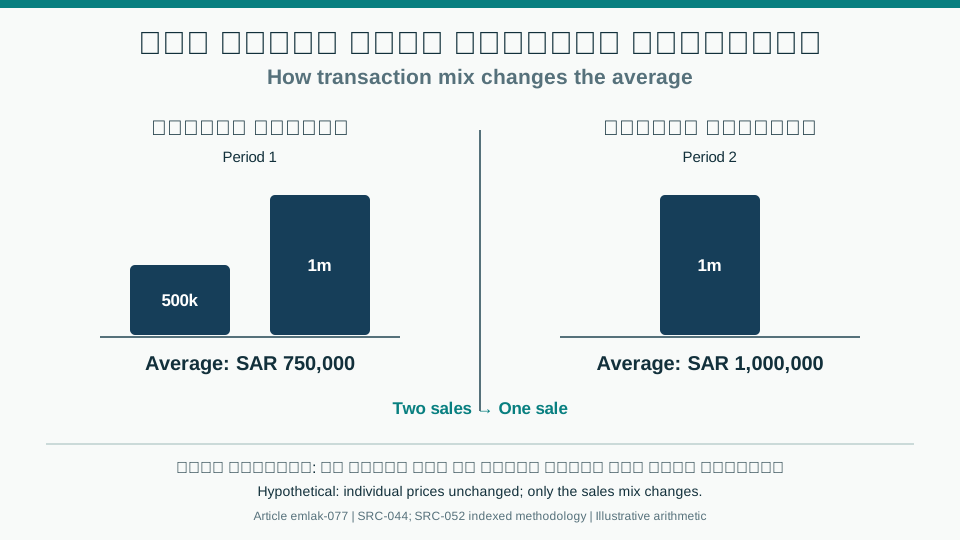
A hypothetical example: two sales at SAR 500,000 and SAR 1 million average SAR 750,000. If the next period records only the higher-priced unit at SAR 1 million, the average rises to SAR 1 million despite unchanged assumed prices. Average transaction value alone cannot establish price appreciation for comparable assets.
How to test the explanation
Review transaction counts, values and price indices by sector, region and period, adding marketing duration, inventory and financing costs where reliable data are available. Compare similar assets and avoid causal conclusions from one indicator. Historical figures from the original article should be checked against official statistical releases before reuse.
Decision review table
| Factor | Evidence or action |
|---|---|
| Transaction count | Market activity, not price direction alone |
| Average value | Sensitive to transaction mix |
| Price index | Change under a defined methodology |
| Inventory | Supply and marketing time |
A visual reading of the article topic
- 01Separate price from activity
- 02Transaction mix effect
- 03How to test the explanation
- 04Decision review table
Practical workflow
- 01 Define sector and location
- 02 Collect indicators
- 03 Isolate mix effects
- 04 Test hypotheses
Conceptual editorial diagram; not measured data.
Topics and source excerpts
| Topic | Excerpt from article |
|---|---|
| Separate price from activity | Transaction volume counts deals during a period, while a price index measures changes in asset prices using a defined methodology. |
| Transaction mix effect | A hypothetical example: two sales at SAR 500,000 and SAR 1 million average SAR 750,000. |
| How to test the explanation | Review transaction counts, values and price indices by sector, region and period, adding marketing duration, inventory and financing costs where reliable d… |
| Practical workflow | 01 Define sector and location |
| Sources and limitations | Editorial development based on the author's original Emlak article; previous text retained. |
Source excerpts organized for comparison, not newly researched findings.
Sources and limitations
Editorial development based on the author's original Emlak article; previous text retained. The example is hypothetical. Q1 2026 figures in the source require reconciliation with official GASTAT releases and REGA indicators before being presented as verified data.
- GASTAT: Real Estate Price Index methodology, April 2025 — Indexed methodology on changes by category, region, period and registered transactions, 2023 base; not a 2026 results release.
- REGA: Real Estate Indicators FAQ — Location, type and time filters and coverage limits; averages do not value a specific property.