

Supply is not sufficient evidence
The source connects new supply to the market's capacity to absorb products at appropriate price, location and specification. Chart 10 on printed page 12 of SAMA's Q2 2026 Inflation Report, citing GASTAT, reports Saudi property prices down 1.6% year on year in Q1 2026, then up 1.3% in Q2. Index movements do not prove supply alone caused the change.
Absorption and effective price
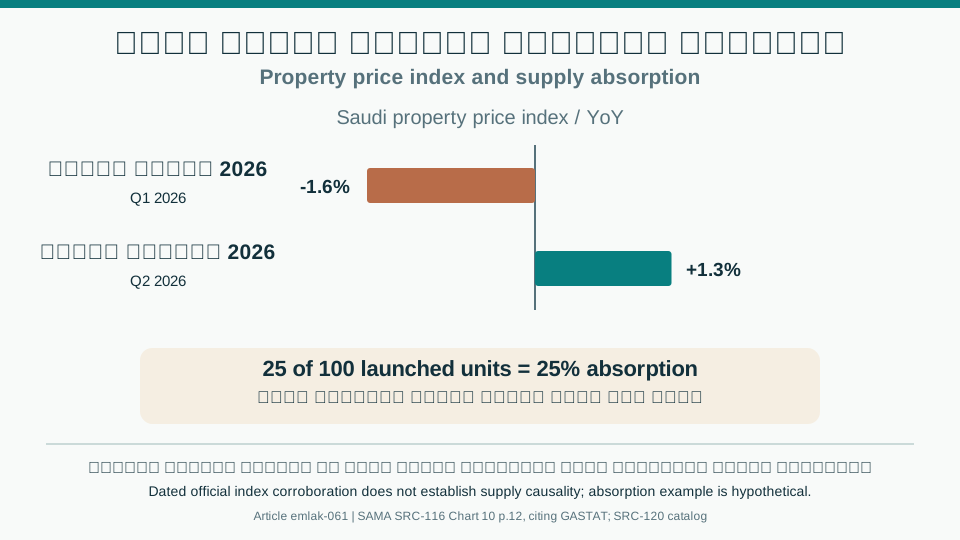
Assume 100 launched units with binding contracts for 25 in one month: batch absorption is 25% over that period under this simplified definition. Track cancellations, contract timing and delivery. Asking prices may remain unchanged while discounts, fee coverage or upgrades change effective pricing and comparability.
Development decisions
Test products by district, segment, price and affordability rather than judging an entire city. Monitor existing and upcoming supply, sales periods and qualified demand. Phase delivery against actual absorption, finance and costs rather than expanding before identifying causes of weak demand.
Decision review table
| Factor | Information or evidence |
|---|---|
| Q1 2026 | -1.6% headline YoY |
| Q2 2026 | +1.3% headline YoY |
| Absorption | 25% — hypothetical |
| Price | Effective after incentives |
A visual reading of the article topic
- 01Supply is not sufficient evidence
- 02Absorption and effective price
- 03Development decisions
- 04Decision review table
Practical workflow
- Segment product
- Measure demand
- Track absorption
- Adjust phases
Sources and limitations
Topics and source excerpts
| Topic | Excerpt from article |
|---|---|
| Supply is not sufficient evidence | The source connects new supply to the market's capacity to absorb products at appropriate price, location and specification. |
| Absorption and effective price | Assume 100 launched units with binding contracts for 25 in one month: batch absorption is 25% over that period under this simplified definition. |
| Development decisions | Test products by district, segment, price and affordability rather than judging an entire city. |
| Sources and limitations | Editorial expansion of the author's Emlak contribution; previous text retained. |
Source excerpts organized for comparison, not newly researched findings.
Editorial expansion of the author's Emlak contribution; previous text retained. Dated official corroboration of GASTAT data in SAMA's report, not the original GASTAT release; it does not establish a causal supply effect. Absorption example is hypothetical.
- SAMA: Q2 2026 Inflation Report, Chart 10, p. 12 — Official corroboration of GASTAT figures: Q1 −1.6% and Q2 +1.3% YoY; not evidence of causal factors or project absorption.
- GASTAT: Real Estate Price Index publications catalog — Indexed catalog snapshot lists Q1 and Q2; not numerical evidence and does not establish absence of a Q3 release.