

Purchase price is the starting point
The article relates investment value to the asset’s capacity to generate income rather than price per square metre alone. Include purchase, acquisition and fit-out costs, then estimate rents after vacancy and collection losses and operating and maintenance expenses. Net operating income allows operating comparisons before financing, taxes and capital expenditure.
An illustrative comparison
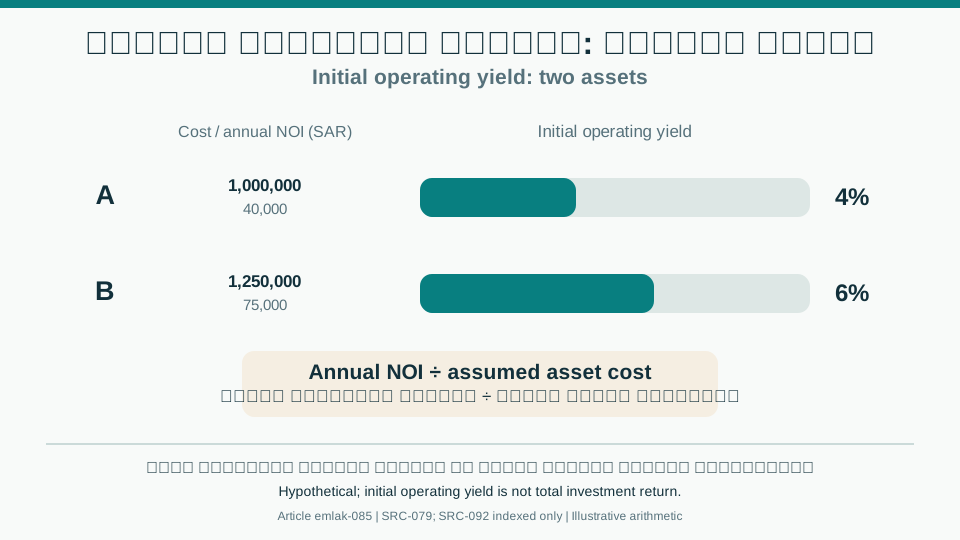
Hypothetical SAR example: asset A costs one million and generates annual NOI of 40,000, implying a 4% initial operating yield. Asset B costs 1.25 million with NOI of 75,000, implying 6%. The higher-cost asset may look better on this measure, but capital expenditure, financing, vacancy and exit risks can change the decision. Initial operating yield is not total return on investment.
Testing the decision
Translate expected income into annual cash flows after debt service and capital expenditure, distinguishing resale appreciation from income during ownership. Stress-test lower occupancy, higher costs and delayed exit; assess holding-period cash flows rather than payback alone. Check contracts, inspection and comparables before committing.
Hypothetical initial operating yield
| Asset | Annual initial yield | Relative bar (one block = one percentage point) |
|---|---|---|
| A | 4% | ████ |
| B | 6% | ██████ |
A visual reading of the article topic
- 01Purchase price is the starting point
- 02An illustrative comparison
- 03Testing the decision
- 04Hypothetical initial operating yield
Illustrative assumptions, not market observations.
Decision review table
| Factor | Evidence or action |
|---|---|
| Total cost | Purchase, fit-out and acquisition costs |
| NOI | Effective income less operating expenses |
| Cash flow | NOI after debt service and capital expenditure |
| Exit | Net resale proceeds, timing and liquidity risk |
Practical workflow
- 01 Establish cost
- 02 Estimate NOI
- 03 Stress-test cash flows
- 04 Compare risk and exit
Conceptual editorial diagram; not measured data.
Topics and source excerpts
| Topic | Excerpt from article |
|---|---|
| Purchase price is the starting point | The article relates investment value to the asset’s capacity to generate income rather than price per square metre alone. |
| An illustrative comparison | Hypothetical SAR example: asset A costs one million and generates annual NOI of 40,000, implying a 4% initial operating yield. |
| Testing the decision | Translate expected income into annual cash flows after debt service and capital expenditure, distinguishing resale appreciation from income during ownershi… |
| Hypothetical initial operating yield | Illustrative assumptions, not market observations. |
| Practical workflow | 01 Establish cost |
| Sources and limitations | Editorial development based on the author’s original Emlak article; previous text retained. |
Source excerpts organized for comparison, not newly researched findings.
Sources and limitations
Editorial development based on the author’s original Emlak article; previous text retained. Figures are illustrative, not market data or recommendations. Initial operating yield equals annual NOI divided by assumed asset cost, not total return.
Initial yield on assumed cost differs from capitalization based on assumed market value, and from debt service coverage. No Saudi lending threshold is inferred from the indexed educational reference.
- US Federal Reserve: Policy Statement on Prudent Commercial Real Estate Loan Accommodations and Workouts — Direct capitalization of stabilized NOI, assumption limits and distinction from discount rates; US supervisory guidance, not a Saudi market yield.
- J.P. Morgan: What Is Debt Service Coverage Ratio in Real Estate? — Indexed lender educational article dated 29 September 2026; DSCR compares annual NOI with annual debt service (principal and interest), subject to lender conventions. No Saudi threshold or credit approval.