

A city is not a single indicator
The article proposes that Saudi markets differ with employment, projects, internal migration and demand composition. Treat these as testable hypotheses rather than a permanent city ranking. Riyadh, Jeddah, Dammam and Khobar contain varied neighborhoods and products; within-city variation may exceed the apparent difference between two citywide averages.
Building a sound quantitative comparison
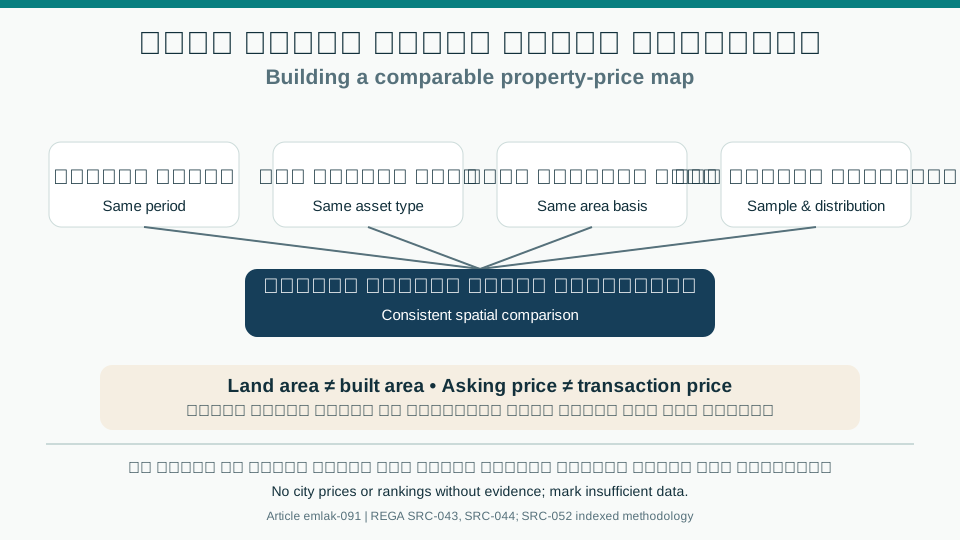
Collect transactions for the same period by city, district, land or unit type and condition. Separate land from buildings and land area from built area. Use price per square metre only with equivalent denominators; report sample counts, distributions and medians alongside an established index when available. Do not equate average transaction value with appreciation of comparable assets.
Mapping investment decisions
Compare prices with employment, services, travel times, actual rents, vacancy and planned developments. Some districts merit separate analysis because uses differ or transactions are sparse. In a map, use consistent periods, sectors and price units, and mark insufficient-data areas rather than coloring them with unsupported estimates.
Decision review table
| Factor | Evidence or action |
|---|---|
| Riyadh | Employment, growth and project hypotheses |
| Jeddah | Services, regeneration and supply hypotheses |
| Dammam and Khobar | Local economic activity hypotheses |
| Mid-sized cities | Market depth, income and development |
A visual reading of the article topic
- 01A city is not a single indicator
- 02Building a sound quantitative comparison
- 03Mapping investment decisions
- 04Decision review table
Practical workflow
- 01 Align period and asset type
- 02 Collect reliable indicators
- 03 Review distribution and sample size
- 04 Build an interpretable map
Conceptual editorial diagram; not measured data.
Topics and source excerpts
| Topic | Excerpt from article |
|---|---|
| A city is not a single indicator | The article proposes that Saudi markets differ with employment, projects, internal migration and demand composition. |
| Building a sound quantitative comparison | Collect transactions for the same period by city, district, land or unit type and condition. |
| Mapping investment decisions | Compare prices with employment, services, travel times, actual rents, vacancy and planned developments. |
| Practical workflow | 01 Align period and asset type |
| Sources and limitations | Editorial development based on the author’s original Emlak article; previous text retained. |
Source excerpts organized for comparison, not newly researched findings.
Sources and limitations
Editorial development based on the author’s original Emlak article; previous text retained. No city prices or rankings are presented without dated evidence from sources such as REGA and GASTAT. The table defines analytical hypotheses, not numerical findings.
- REGA: Real Estate Indicators FAQ — Location, type and time filters and coverage limits; averages do not value a specific property.
- REGA: Real Estate Indicators Platform — Distinguishes transaction count, value, area and mean transaction value (total value divided by count); no numerical city series adopted.
- GASTAT: Real Estate Price Index methodology, April 2025 — Indexed methodology on changes by category, region, period and registered transactions, 2023 base; not a 2026 results release or city ranking.