
What does the evidence say?
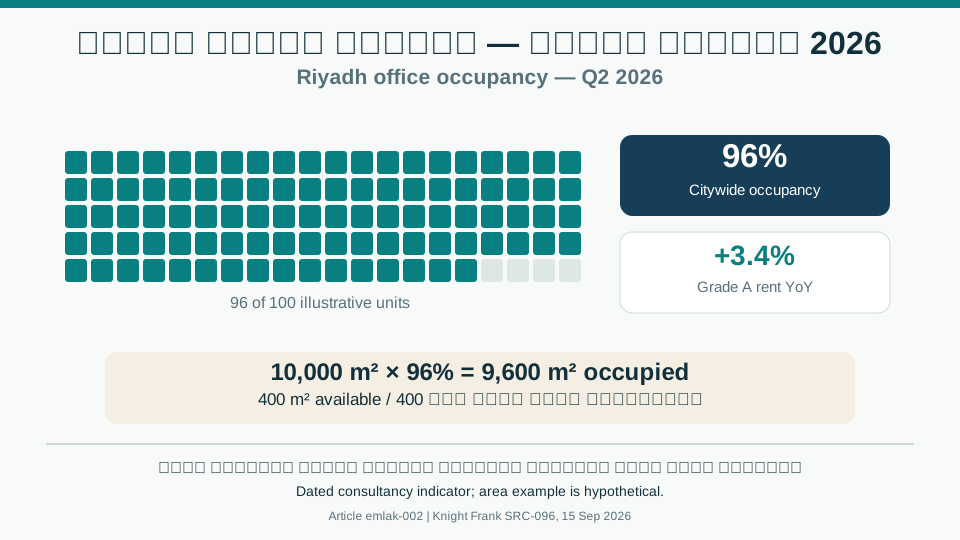
Knight Frank's 15 September 2026 report on Q2 recorded city-wide office occupancy of 96% and 3.4% annual growth in Grade A office rents. These are dated consultancy indicators, not measurements of every property or district or a guarantee of future growth.
Demand and product quality
The historical article links demand to business expansion, headquarters, projects and supporting services. Distinguish announced demand from signed leases and occupied space, and compare building quality. Evaluate accessibility, flexibility, operating efficiency and suitability.
Interpreting occupancy
For an illustrative office building with 10,000 m² of leasable space and 96% occupancy, occupied space is 9,600 m² and available space 400 m². This explains the metric, not an actual property; area occupancy does not necessarily equal cash collection or profitability.
Read dated indicator
Define segment and location
Review supply
Test feasibility
Developer decisions
Compare existing supply, planned additions and delivery dates, and test construction, fit-out, financing and leasing periods. Modular and modern construction can help when suitability and economics are established. High current occupancy alone does not justify new supply.
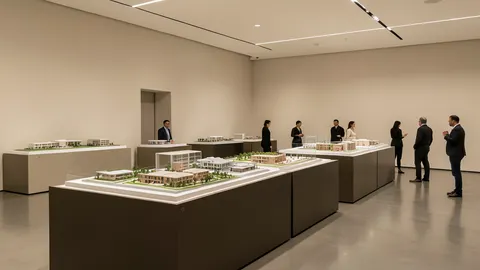
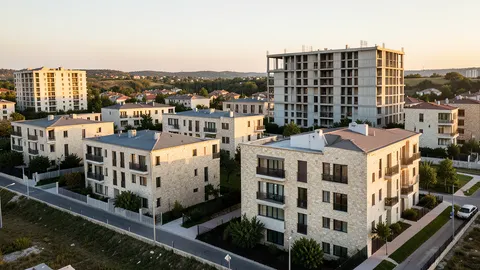
A visual reading of the article topic
- 01What does the evidence say?
- 02Demand and product quality
- 03Interpreting occupancy
- 04Developer decisions
Indicators and review table
| Factor | Information or evidence |
|---|---|
| Occupancy | 96% city-wide, Q2 2026 |
| Rent | Grade A annual growth: 3.4% |
| Supply | Pipeline, delivery and competing space |
| Decision | Stress-test occupancy and costs |
Review pathway
- Read dated indicator
- Define segment and location
- Review supply
- Test feasibility
Topics and source excerpts
| Topic | Excerpt from article |
|---|---|
| What does the evidence say? | Knight Frank's 15 September 2026 report on Q2 recorded city-wide office occupancy of 96% and 3.4% annual growth in Grade A office rents. |
| Demand and product quality | The historical article links demand to business expansion, headquarters, projects and supporting services. |
| Interpreting occupancy | For an illustrative office building with 10,000 m² of leasable space and 96% occupancy, occupied space is 9,600 m² and available space 400 m². |
| Developer decisions | Compare existing supply, planned additions and delivery dates, and test construction, fit-out, financing and leasing periods. |
| Review pathway | Read dated indicator |
| Sources and limitations | Editorial expansion of the author's Emlak contribution; historical text retained. |
Source excerpts organized for comparison, not newly researched findings.
Sources and limitations
Editorial expansion of the author's Emlak contribution; historical text retained. The building example is hypothetical.
Knight Frank: Saudi residential and office sector, Q2 2026 — Dated consultancy report supporting occupancy, prices and transactions within its scope; not an official statistical series or individual valuation.